Controlling Scope Changes During Design

Scope changes during design are inevitable — but unmanaged changes cause cost escalation, delays, and rework.

1. Common Sources of Design Change

  • Client-driven modifications.
  • Coordination conflicts (e.g., MEP vs. Structure).
  • Regulatory compliance updates.
  • Design development refinements.
  • Errors or omissions found during peer review.

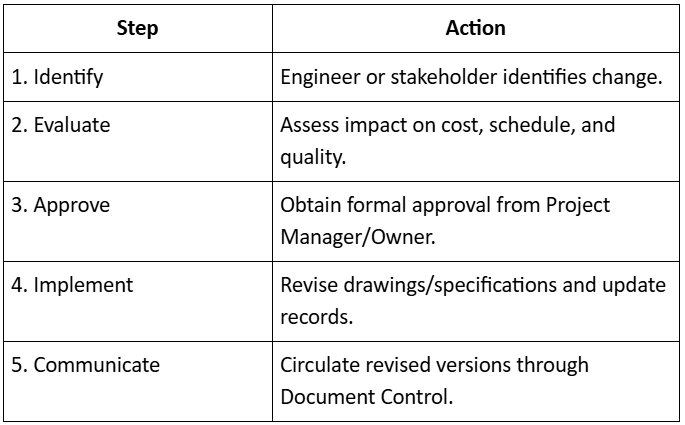
2. Change Control Workflow

Controlling Scope Changes During Design

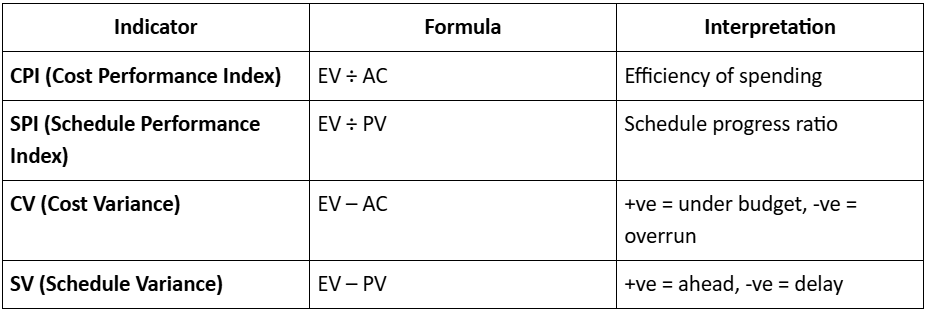
3. Tools for Scope Control

  • Design Change Register (DCR)
  • Request for Information (RFI) logs
  • Change Order Forms with justification
  • Version History Reports
“Every design change must be visible, justified, and approved — not just assumed.”

Managing the Design Process

The design process is the backbone of every construction project. Managing it efficiently means synchronizing multiple disciplines—architectural, structural, MEP, and civil—toward a unified vision and timeline.

1. Design Management Roles

Managing the Design Process

2. Design Workflow Stages

  • Concept Design → Owner’s vision translated into preliminary sketches.
  • Design Development → Technical details added; disciplines coordinate.
  • Construction Documentation → Issued-for-construction (IFC) drawings and specs prepared.
  • As-Built Documentation → Updated drawings post-construction for record keeping.

3. Design Management Best Practices

  • Maintain a Design Deliverable Register (DDR) with status tracking.
  • Use the Design Responsibility Matrix (DRM) for accountability.
  • Follow controlled document numbering and revision tracking.
  • Adopt digital collaboration tools (BIM 360, Orangescrum, or Revit Cloud).
“Reporting is not about documenting progress — it’s about driving it.”

Progress Reporting Systems

Tracking and control are incomplete without structured reporting that communicates progress clearly and objectively.

1. Reporting Framework

Progress Reporting Systems

2. Modern Reporting Tools

  • Orangescrum Project Dashboards – task % completion and workload summaries.
  • Primavera P6 / MS Project – Gantt & variance reports.
  • BI Dashboards (Superset BI) – visual EVM analytics and automated alerts.
  • Digital Logs – site photos, drone progress, and IoT sensors for productivity tracking.

3. Reporting Best Practices

  • Base every figure on verified data.
  • Use visual aids (S-curves, bar charts, variance graphs).
  • Highlight exceptions and actions — not just data.
  • Archive all reports for audit and claims reference.
“Every completed design is a prototype for the next — if you take time to learn from it.”

Module Summary

  • Integrating WBS, CPM, and Budget provides a unified control framework.
  • EVM enables objective performance measurement and forecasting.
  • S-curves and trend analysis turn raw data into actionable insight.
  • Variance control ensures corrective action before overruns occur.
  • Structured progress reporting systems maintain transparency and accountability.

Variance and Trend Analysis

Variance analysis identifies why performance differs from plan; trend analysis predicts where performance is heading.

1. Variance Analysis

Performed for:

  • Cost Variance (CV) – Difference between planned and actual costs.
  • Schedule Variance (SV) – Difference between planned and earned progress.
  • Productivity Variance – Gap between planned and achieved outputs.

2. Root Cause Identification

Common reasons for variance:

  • Underestimation of work quantities.
  • Delayed approvals or design changes.
  • Resource inefficiency or poor productivity.
  • Weather or logistics constraints.
  • Rework due to quality issues.

Corrective Measures:

  • Re-sequence non-critical activities.
  • Increase productivity on critical path tasks.
  • Reallocate resources (labor or equipment).
  • Negotiate change orders if client-driven.

3. Trend Analysis

Tracks key metrics over multiple periods to identify improvement or deterioration.

Tools:

  • CPI/SPI trend charts
  • Moving average of monthly variance
  • Performance heatmaps by WBS section
  • Milestone trend analysis (MTA)
“Trends tell the truth long before reports do.”

Time–Cost Integration and Forecasting

Once EVM metrics are in place, the next step is forecasting future performance and estimating final project outcomes.

1. Key Forecasting Metrics

Time–Cost Integration and Forecasting

Example:

If BAC = ₹100 Cr and CPI = 0.9

EAC = ₹100 Cr + ₹0.9 Cr = ₹111.1 Cr

This results in a projected overrun of 11.1%.

2. Time–Cost S-Curves

S-curves graphically display cumulative planned cost, actual cost, and earned value over time.

They allow quick visual comparison of progress trends and performance gaps.

Curve Zones:

  • Early stage: Low cost, low progress.
  • Middle stage: Steep curve (active execution).
  • Final stage: Flattening curve (close-out).

3. Forecasting Best Practices

  • Update EVM weekly or biweekly.
  • Validate progress quantities through site reports.
  • Re-baseline only for approved changes.
  • Analyze trends over time, not just snapshots.
“Forecasting is not prediction—it’s prevention.”

Performance Measurement & Earned Value Method

Earned Value Management (EVM) is the cornerstone of modern project control.

It quantifies performance by integrating scope, time, and cost into one system.

Key EVM Terms

Performance Measurement & Earned Value Method

Performance Indices

Performance Indices

Example:

  • PV = ₹10,00,000
  • EV = ₹8,00,000
  • AC = ₹9,00,000

CPI = 8/9 = 0.89
SPI = 8/10 = 0.8

The project is over budget (CPI < 1) and behind schedule (SPI < 1).

Benefits of EVM

  • Objective performance measurement
  • Early warning of deviations
  • Enables data-driven decisions
  • Integrates cost, schedule, and scope reporting
“Earned Value turns project intuition into measurable insight.”

Category: Construction Academy

Subcategory: Budgeting and Planning

Subcategory: Construction Phase

Subcategory: Design Coordination

Subcategory: Estimation Techniques

Subcategory: Initiation and Feasibility

Subcategory: Introduction

Subcategory: Personal Management

Subcategory: Project Close-Out

Subcategory: Project Scheduling

Subcategory: Project Teams

Subcategory: Proposal Management

Subcategory: Total Quality Management

Subcategory: Tracking and Control

Subcategory: Work Breakdown

Category: Help Desk

Subcategory: Client

Subcategory: Construction 101

Subcategory: Contractor Management

Subcategory: Expense

Subcategory: Finance Budget

Subcategory: Inventory Management

Subcategory: My Approvals

Subcategory: Site Management

Subcategory: Vendor Management